Underestimated the role of the disk
Practice set out above applies to all IT hardware and disk arrays are no exception. Specifications published in their numbers to show us how much they are efficient, they look more specifically:
- bandwidth within the Matrix - heavy GB / s
- the amount and speed of the internal processors - as powerful computational servers
- FC port capacity - several Gb / s
- cache memory - disk array capacity as a few years ago
These values suggest that performance of such a system will be very high. But it is not quite true. Most of the information refers to the maximum capacity of individual sub-arrays, and these are significantly different from the real performance of the whole.
The construction is as strong as its weakest component. While this applies to both the strength of the bridge, as well as by the disk array. It is interesting that in speaking of storage capacity, is rarely mentioned disks. This is probably the fact that almost all manufacturers assemble the same set of drives in their devices. It is not a parameter that can be used to compare competing equipment. Yet it is the hard drive is the weakest element of the array otherwise the disk and it is its ability to determine the entire power storage solutions.
Data Retrieval in Dallas - salvage data recovery service | hard drive and raid data recovery
The hard disk drive and its limitations
Disk drive performance results from two parameters - the average seek time (the average head positioning time) and RPM (rotational speed disks). The fastest current drive values for these parameters is 3.1 ms avg seek time and 15,000 RPM. In February 2009 marked the ninth anniversary of the release of the first disk spinning 15 000 revolutions per second. The average head positioning time it was only 0.8 ms longer than the disks manufactured today. This means that within nine years of hard drive capacity has increased by 16%. How does this relate to the power of processors? In 2000, record TPC-C is 7545 tpmC on the processor. The current record is 190 161 tpmC per processor - that productivity has increased by 2520%! This huge gap results from the difference in the construction of these components. The disk has mechanical parts, moving head and spinning plates. Reducing delays associated with the "analog-'is now physically impossible. Solutions in 100% digital, as processors, have not yet reached their physical limits and, hence, their options may still be increasing.
Writing about the disk parameters indicative of his performance, I have not mentioned anything about the capacity, interface type and maximum speed of data transfer. I did it deliberately, as these figures say nothing about the real power drive. The only valid parameter for disk performance is the average random IOPS, the average number of random read or write operation can be made in one second. It stems precisely from the delays generated by the spinning head and the disk. In view of the fact that this parameter is not published in the specifications you need to know how to find it. To do this, we count how many takes half a turn in our disk platter. In this way, we get average rotation latency, which is the average time it takes to turn the disk to the specified sector:
average rotation latency = 1/(RPM/60)/2
RPM rotational speed, of course, drive specifications. Add to this the average seek time, we get the average time the drive and the head of the specified sector of data, average access latency:
average access latency = average rotation latency + average seek time
Now, just calculate how much disk I / O with this delay is able to perform within seconds and we have our average IOPS for random transactions:
average random disk IOPS = 1 / average access latency
What then is the value of this parameter for the fastest drive on the market today?
1 / ((1/15000/60)/2 + 0,0031) = 196,08
Having calculated parameter IOPS, we can see what the actual data transfers are possible to achieve on this drive. Note, however, they depend on the amount of data contained in a single disk I / O. So:
- for 4 kB - 784 kB/s
- for 8 kB - 1568 kB/s
- for 32 kB - 6274 kB/s
- for 256 kB - 50196 kB/s
Taking into account that in a typical business application that the average size of I / O operations are rarely larger than 32 KB, the numbers are not large. The value of the parameter IOPS is also rather low (especially when compared, for example, with hundreds of billions of bytes of available capacity).
Of course, quite easy to tweak this parameter, for example, limiting the movement of the head to a smaller area on the disk or replace a random sequential operations, which in nature are rare, especially on the hard matrix. Do not give it to us, however, reliable information about the performance of the entire disk in real terms. Therefore, only the average number of IOPS for random transactions is a real indicator of performance.
Few drives - wrong, a lot of discs - well
If you lost your data you can use one of our offices. For example raid data recovery in New York.
But just as the bridge gets its strength not by suspending it in one, and in many Tendons, so the matrix is efficient only when added to the number of disks. A multitude of drives in the array is its basic feature, which builds the capacity, availability, and that system performance. Only a large number of disks in a well-designed solution causes the disk subsystem performance are acceptable.
I will venture to say that knowing the parameters of installed drives, and their quantity, we have all the information necessary to identify the opportunities that lie dormant in modern disk array any major manufacturer. In the past it was not so sure, but today the components such as processors, interfaces, or buses are so fast that the correct configuration is not the reason for the emergence of bottlenecks.
The best evidence to confirm this assumption are the results of tests conducted by the Storage Performace Council. This organization, as the first, has to attempt to measure the performance of storage systems. To this end, SPC has developed a number of tests tailored to the kinds of equipment and its intended use. For the study of disk arrays in transaction systems environment was SPC-1 test. It aims to measure the performance of the hardware in terms of data processing in typical business applications (database, mail server, ...). I / O in such a system characterized by a high randomness and small blocks of data. Available on the test device, disk space is divided into three parts (ASU). Each corresponds to different types of data - Data Store, User Store, Log Store. On each of the sessions are run ASU (I / O stream) carrying out processing in accordance with the specificity of ASU. Generated streams of I / O are both sequential and random - but with a large majority of the latter. The result is given in the unit referred to as SPC-1 IOPS ™.
The first SPC-1 results were published in 2002. So far there are no longer their 70th. Nearly every major company provides its equipment to be tested. These are both small matrices (after several disks), and large plants - with over a thousand drives. I collected all the results of SPC-1 and checked as to not affect the number of discs in the test solutions. The graph below illustrates this experience:
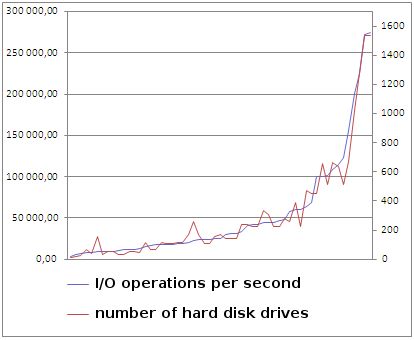
The blue line is the amount achieved an SPC-1 IOPS ™. The red line shows the number of disks. As you can see, both are strongly linked. It turns out that despite seven years of technological progress, different FC speeds, different amounts of cache memory, dozens of types and versions of software all still depends on how many drives can fit in the device. For one of the main producers of this fact is one of the arguments against taking part in the tests SPC. In my view, however, SPC has a meaning, and the fact that the publication of the results is testimony that the solution is well designed and allows you to "draw" with a relatively low drive as much as possible.
Cache
Although the dominant influence is undeniable drive, there is one more element, whose importance for the efficiency can not be ignored. It is the cache - internal memory array, which is logically placed between the disks and servers that use them. In fact, referring to data on the array, never reach out directly to disks, and just to the cache. Only in the situation when necessary, internal mechanisms for reading or writing something from the drive. Well, but when they need it? If the read operation, it becomes if the cache does not have the required data. Such an event is defined as a read cache miss, and its opposite is a read cache hit. If surgery becomes necessary only save when you save the area is rarely updated. This operation is denoted as a write cache miss, and the reverse situation - write cache hit. The greater prevalence of hits (hit) on the boxes (miss) the better. In practice, the environment, transaction systems, the number of hits for the readings to 60-70% of all such operations, and for records of 20-30%.
In addition to this basic function, the cache can still use other mechanisms, such as:
- folding of random sequences of operations
- parity calculation for RAID 5 and 6 in the "fly", without having read it from disk
- detecting a sequence of operations
- prefetching
All these have one common goal - relief drives. The amount of memory cache when it is quite important. The large number of significantly improved performance of the entire solution.
Counting efficiency of the matrix
Since the impact of other components on the performance you can basically ignore, and since we know how to calculate the performance of a single drive, why not try to estimate the power of the whole matrix? I do not see obstacles, at least for the operation of chance. This is not a simple sum of random IOPS average for all installed drives. There are several parameters that affect the performance of the entire solution. They are associated with both the matrix configuration and characteristics of I / O generated by applications. Here they are:
RAID level - for reading is not relevant, but in the case record is quite significant. One block of data commissioned to write an application will properly: 1 I / O operations on the volume formatted in RAID 0, 2 operations where RAID 10 (one entry for each of the mirrors), 4 for RAID 5 (data read, read parity , write data, write parity) and as many as 5 or 6 for RAID 6 (read data, read parity, write data, write parity 2x).
The ratio of read operations to write - if the records other than for RAID 0, are more costly operation, their number in relation to the readings is essential.
Stripe size of the matrix, the average amount of data on disk I / O and data block size which the application operates - on the basis of these three values we can calculate the probability of a situation when a single I / O does not "fit" on one disk. This happens when the data block, as it is concerned, it starts on one disk, and ends on another. For example, if the size of I / O is 256 KB and it is equal to the size of the matrix stripe'a, and the space on the volume is divided into blocks by application 0.5 kb, the probability that for this operation will be used for two disks, is almost equal to 1
% of hits in the cache array for recording and reading - if I / O refers to data that are in the cache does not require direct access to the disk.
With the above information and of course the parameters of the installed drives and their quantity, we can calculate the average number of random disk I / O may be obtained from the matrix. In view of the fact that I never found an appropriate formula, I made an attempt to draw it yourself. Finally, it looks like:
average random array IOPS = (disks * diskIOPS) / ((1 + ((ioSize * 1 / appBlockSize) - 1) / (stripeSize * 1 / appBlockSize)) * reads / 100 * (1 - readCacheHitRatio / 100) + writeIO * ( 1 + ((ioSize * 1 / appBlockSize) - 1) / (stripeSize * 1 / appBlockSize)) * writes / 100 * (1 - writeCacheHitRatio / 100))
The result of this formula is of course only an estimate. However, it gives a pretty good idea of what can be expected after the dissolution of the desired configuration and under certain conditions. The formula I implemented in my calculator, performance and capacity disks and disk arrays available at http://www.wmarow.com/storage/strcalc. Persons interested in an explanation of why it looks like this, please contact us directly.
Self-tests
The resulting number of IOPS can be used to compare with actual results achieved during the performance tests. My favorite tool for their exercise is cross-platform application Vdbench, available under the open source software. It is a generator of data streams that can be directed to any storage device connected to the server. It helps zasumulować processing of specific parameters such as: the amount of data I / O operations, the ratio of reads to the records, the cache hit ratio (for both reads and writes), the intensity generated by the operation, the ratio of random to sequential operations. The machine on which the benchmark run and of course it must be strong, configured and connected to the matrix.
Actually, the tests and compare them with the expected results can be very strong argument for choosing the right solution, or a decision to change the configuration (for example, choose a different RAID level).
Accelerating
There are several ways to make storage solutions faster. First, a limitation of the area used for each of the drives to the external part of the plates. This reduces head movement, and consequently, reducing delays and increasing the number of IOPS. At the cost of this operation is to reduce the available capacity. This means that the solution will be faster but more expensive.
The second method is fading so-called "hot regions", which groups the most loaded disks. Volumes established in these areas should be spread over the matrix in such a situation, a larger number of devices. In the traditional pool of disk array is divided into relatively small groups of RAID. Although most of them can be used as a minimum, the capacity of the entire solution will decide These congested. This problem does not occur in solutions using wide striping technology, where every single volume of the standard is extended by many, even after all the disks. Returning to the analogy of a bridge - it is secured in such a case all the available strands. Maybe at the same time to enter as many cars as it is able to handle all such protected design. If the matrix is divided into groups of disks, each of them represents a separate bridge. While the majority of traffic is sporadic, with few cars have to wait until the other cars will gather in congested construction.
And of course, SSD drives. Ways to use them in several matrices. It is difficult now to say which of them will be the standard. The simplest seems to be replacing these discs. SSD performance from them is an order of magnitude larger. But they have some disadvantages. The main one is the high price at a relatively low capacity. Seems more profitable to use them as a kind of cache. To this end, attempts are being made use of adaptive technology, Tiering, which automatically detect the degree of utilization of individual volumes, or blocks of data and migrate them between classes (tier) of storage with different performance. There is also the question of how the device will be called with that kind of drives? For sure it will not have a storage array, or at least not just storage. In addition, the spread of SSD solutions will cause 90% of the information contained in this document will become irrelevant or obsolete.
Finally
Early in his career specialist for storage under the impression that the powerful equipment, which administers, have endless possibilities. The great, mysterious, flashing colored LEDs. It focuses on learning the GUI and CLI. It teaches how to create volumes and expose them to the servers. With time, meets the advanced features - a copy of local data replication. Attention to emerging problems with efficiency - says that such a powerful machine can not be the cause. But the sooner he realizes himself that the power of this device depends on the drive a little better than he who is in his workstation, the better for the company.